14 Sep 2016|Uncategorised
Construction Activity and Affordability in the UK vs US
One of the things which has always exercised the Government about the ballooning Housing Benefit Bill is the share of the total sum which goes [...]
14 Sep 2016|Demand and Supply
One of the things which has always exercised the Government about the ballooning Housing Benefit Bill is the share of the total sum which goes to support households living in the Private Rented sector and, from there, into the pockets of Private Landlords. Certainly, it was the fastest growing element of an increasingly expensive benefit entitlement.
In the immediate aftermath of the financial crisis, in November 2008, private sector tenants were claiming around £93m/week in Housing Benefit. The next very next year, the figure had grown to £128m/week and the year after that – the first year of the Coalition Government – claims had risen again to £146m/week. From under £5bn a year to £7.5bn a year in just two years – those are the sort of numbers which were bound to worry an austerity-minded Chancellor and it was no surprise that the Welfare Reform Act contained measures to get the Housing Benefit Bill under control.
Those measures included strictures on the eligibility of individuals under the age of 35 to live in self-contained accommodation and, crucially, there was to be a change in the way that Housing Benefit was calculated. Until the passage of the Act, a household could claim Housing Benefit up to the median value of rents for suitably sized homes in their area. After the passage of the Act, the cap was lowered. Henceforth, households would only be able to claim up to the 30th centile of local rents. This cap is referred to as the Local Housing Allowance.
It is possible to have some sympathy with this approach.
First of all, with the Government such a large player in the Private Rented Sector, it might have seemed plausible that restricting the amount of money flowing to landlords from the Government might begin to suppress the long term growth in rents. And, second, limiting HB claimants to the cheaper end of the rental market didn’t seem completely unreasonable. In 2011 at the time of the last census, a little more than 20% of all private sector tenancies were supported by Housing Benefit. In theory then, allowing households who needed assistance to support their tenancy to claim for any rent in the cheapest 30% of the market ought to have allowed for a considerable element of choice.
Four years on, both of those suppositions look wrong.
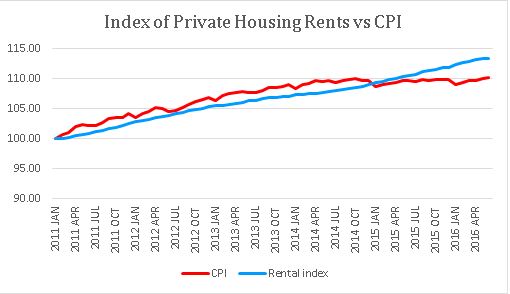
First of all, it is easy to see that private rents have not been suppressed. They continue to rise inexorably and, in recent years, slightly faster than CPI Inflation. Here is the data from ONS:
The second contention is a bit harder to look into – in part because, we just don’t have terribly good data on the operation of the rental market in the UK. In Germany, whose large, stable, professionally run rental market, the UK’s is often exhorted to emulate, all new tenancies are recorded, along with the gross rent and rent per square metre. Robust Indices, dating back many years are publicly available. Not here. The best available dataset in the UK is compiled by the VOA using a data set which aims to capture around 20% of all tenancies.
This is not to denigrate the Rent Officers, who have no power to demand data from landlords and agents but it is curious that data on the sharp end of our national housing crisis should be a matter of polite requests for information and that requests for granular data is often stifled by references to Data Protection laws. This leads to a situation where the VOA often has to estimate the total size of the market that it is supposed to be capturing 20% of. These are not problems the Land Registry faces in respect of sales data…
Still, the VOA’s data is the most comprehensive available. But, there is another problem – the dataset which the VOA is looking for captures all rents – i.e. those paid by sitting tenants as well as new tenancies. That is potentially a sizeable problem. The Survey of English Housing 2015 found that rents vary significantly by length of tenancy – with the longest established tenancies as much as 35% cheaper than the newest. Those long-established tenancies will fill out a significant chunk of the cheaper end of the VOA’s rental spectrum for any given area but, by definition, those properties are not often available.
It is a moot point whether one ought to establish the cost of renting by reference to new tenancies or to all tenancies but the fact remains that a huge proportion of private tenants need to move very regularly. The English Housing Survey found that 55% of all private renters had been at their present address for fewer than two years.
That surely makes it a legitimate exercise to compare the VOA’s dataset of all tenancies with a dataset for new tenancies. For this purpose I have used the website Rightmove. I realise that Rightmove is only one site among many and, because it charges fees, it may skew slightly to the upper end of the market but our own estimates of turnover in a number of areas suggest that it captures the overwhelming majority of the market.
VOA does not make their full dataset available but I have tried to get the charts to VOA’s chart and my own to a comparable size. The following two graphs refer to the distribution of two bed rented properties in Harrogate but I have seen similar patterns in every area I have looked at:
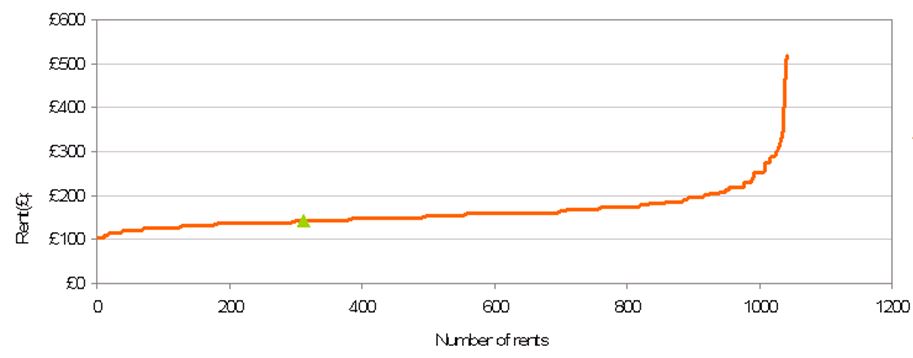
Source: Valuation Office Agency
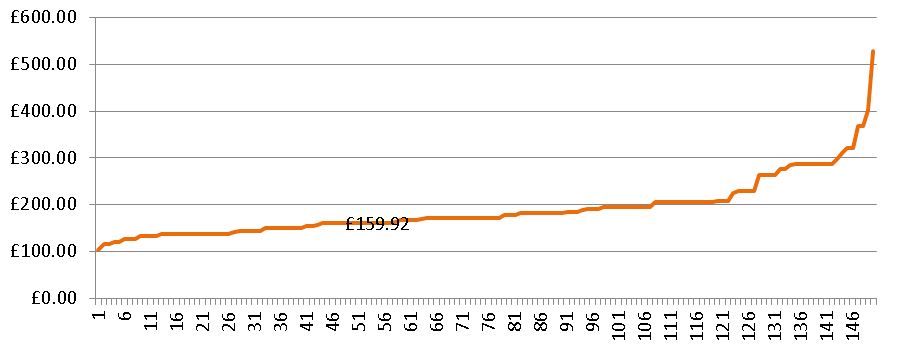
Source: Rightmove
Even in this crude comparison, the point is clear. The plot is the same shape but shifted up. The all important 30th centile rises from £136.93 in the VOA data to £159.92 in the Rightmove data. A difference of £13/week.
In fact, only 16% of available new tenancies are available at a price lower than the Local Housing Allowance and that is before the impact of letting fees (which average around £250), moving costs or the need to find a deposit. Although these costs are “one-off” it is important to remember that a significant proportion of renting households move as often as every year.
It is also worth remembering that according to the English Housing Survey as many as 29% of homes in the Private Rented Sector fail the Decent Homes Standard. Confining the 20% of renting households who require support from Housing Benefit to the cheapest 16% of available properties is giving those households a hard shove in the direction of non-decent homes.
It is also worth saying that those households who need Housing Benefit to help paying the rent but who cannot find a decent home at a price below the 30th centile level (the Local Housing Allowance) have to make up the difference out of their own pocket. The benefit system works on the basis that housing costs should take up no more than 30% of total income – including benefits. Find a home that is available for less than the cap and your Housing Benefit will be reduced until the cost represents about 30% of income again. However, if you are forced to move to a home which costs more than the cap, the level of Benefit you receive will not rise to meet the rent. You simply have to pay a higher proportion of your income in housing costs and have less to spend on other things.
It’s worth saying again, the Private Rented Sector isn’t a long term solution to the needs of those who cannot access an affordable home. And, as the Government freezes the Local Housing Allowance for four years and rents continue to rise, the situation doesn’t seem likely to improve any time soon.