16 Jun 2026|Uncategorised
Construction Activity and Affordability in the UK vs US
You’d think so and, from time to time, various industry talking heads post up comparisons between cities that build a lot and cities that [...]
16 Jun 2026|Uncategorised
You’d think so and, from time to time, various industry talking heads post up comparisons between cities that build a lot and cities that don’t – Austin vs San Francisco is a common pairing – Melbourne vs Sydney too. And I always grumble that these comparisons are a dataset of two.
But then I thought I’d stop grumbling and go and get a proper UK-based dataset.
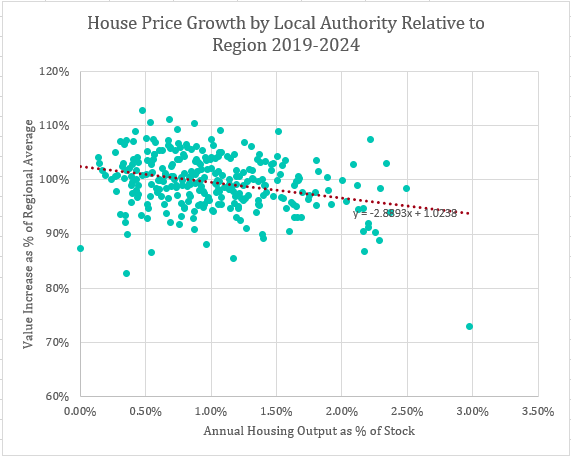
I’ve plotted (almost) every Local Authority in England. The X axis shows annualised housing supply over five years as a percentage of the number of existing households. The average, across the whole country is 0.9% which is a housing output of 224,000/annum.
Then, on the Y axis, I have plotted the change in the median house price over five years relative to the regional average.
So, you might expect that, somewhere like Preston, which added 2.4% to its stock every year for five years, would have seen significantly smaller increases in values than other authorities in the region. I did. But I was wrong. Property prices in Preston grew by 23% compared to 25% across the North West as a whole. Meanwhile, somewhere like Hull built at a quarter the rate of Preston – adding just 0.5% to its stock each year and still saw less growth than the region as a whole – 13% rather than 21%.
I’m cherry picking to make a point but those are oddities. So look at the full dataset in the graph.
Overall, the the correlation between an ambitious housing delivery and suppressed house prices is strikingly weak. If I put error bars on there, they’d be huge. But, even to the extent that a visible trend exists the gradient is very low.
What it suggests is that, if you were to increase housing output by 1% of stock (i.e. double output to 500,000) annum, you might succeed in suppressing house prices by 3% relative to the growth that actually occurred. Let me say that, another way, If we had doubled output median prices today might be £7,000 than they are.
Now look, I know this is nonsense. I do.
If you doubled housing output, you wouldn’t suppress the increase in prices, you’d end up with an overhang, unsold stock, falling prices and the market would cease to build. That seems to be what happened in Austin’s overheated market for rental apartments.
But that isn’t my point.
My point is that boosting housing supply in order to suppress house price inflation has been the foundation of British housing policy since the Barker Review and it doesn’t work.
If it were true that increments to supply were a contollable slider that we could turn up or down to suppress house price inflation to the levels we like, then the planned increment (from current output of 229,000/annum to the target of 300,000/annum) is 0.3% and, based upon the figures above, it would have had almost no impact on values (they’d be about £4,000 lower than they are today).
But it isn’t true. What happens is that the housing market is actually very good indeed at working out what demand is and not supplying the market with more homes than that. That is how we have ended up with over 2 million fewer homes than Kate Barker suggested we needed without any increase at all in overcrowding. However, if the industry were to increase output to the target it would over-supply the market, prices would plummet (as occurred in Austin) or the industry would see it coming and shut down supply (as has occurred in London).
After 20 years, shall we try something different?
Hint: the country is about 1 million social rented homes short of its requirements and the market could absorb them all as fast as industry could build them.
P.S. Expressed on this basis, London’s 90,000 homes per annum target represents 2.62% of households. As such, the whole of London would be the second left-most dot on the chart – ahead even of Preston and behind only the City of London (the spot on the extreme left, whose 146 completions/annum represented 3% of its 4,900 homes. London’s housing targets are just silly.